What Does Net Zero Really Look Like?
First of all, what is the definition of net zero?
The UN defines net zero as “cutting greenhouse gas emissions to as close to zero as possible, with any remaining emissions re-absorbed from the atmosphere.” So essentially, net zero means aiming for no additional carbon dioxide emissions. This means that we must take as much carbon dioxide out of the atmosphere as much as we put in. And – it is a lot easier to avoid putting carbon dioxide into the atmosphere (for example, through installing solar panels!), then to take it out of the atmosphere!
Net Zero by 2050
Net zero emissions by 2050 is a big goal, and is referenced a lot in the media and in the news. However, it can be hard to wrap our heads around what this actually means. This Net-Zero America study aims to visualize and inform people about what it will take to achieve this standard. The report details different ways that the United States can achieve a carbon free economy. One goal of the report is to motivate people to think of net zero as a goal that we are currently working towards, rather than an idealistic future scenario. The rest of this post will touch on some of the highlights of the report, but for a more in depth understanding of the findings, refer to this website.
The Net-Zero America Study
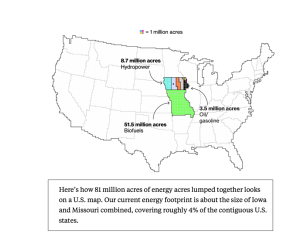
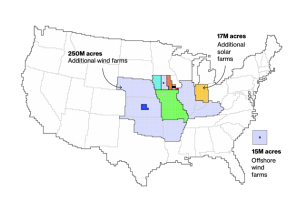
To begin, here we have two maps created using data from the Princeton Net-Zero study, published in an article from Bloomberg Green. The first map shows our current energy footprint, and the second shows the required energy footprint for the most land-intensive scenario as described in the report. Our current energy footprint is 81 million acres, and the second future map shows what a total of 363 million acres would look like all bundled together on the map.
The report outlined many different ways that we can achieve net zero by 2050. These scenarios each use a different combination of renewables to achieve the goal. The reason for that is different types of renewables have different land use requirements. For example, a single solar farm can be more than ten acres large, while a nuclear power plant uses much less space. So, in the scenario that takes up the most land, the United States would have eliminated all nuclear power plants, and all fossil-fuel burning plants. The majority of energy would be provided (98%) by solar and wind.
For the least amount of land use, the US has the option to build nuclear and natural gas plants, and in turn use less solar and wind. Specifically, 250 nuclear plants would need to be built. Due to the differing opinions about nuclear energy production and placement, this option may cause more controversy. Under this scenario, solar and wind would make up less than 50% of electricity generation.
In a third scenario, most energy still comes from wind and solar. Specifically, wind and solar provide quadruple the amount of energy from what they produced in 2020. However, backup power and energy at peak demand would come from hydroelectric power, batteries, and combustion turbines. This alternative takes up less land than the first all-renewable situation.
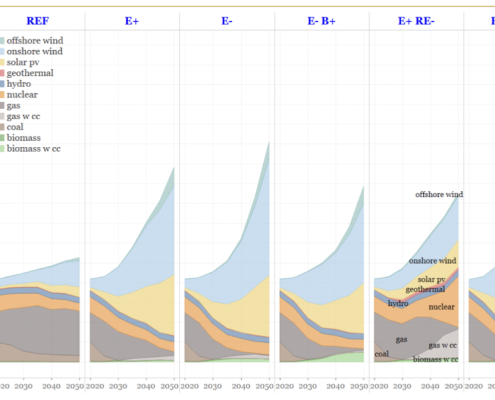
The graph below is taken directly from the Net-Zero America Report. It demonstrates the different types of electricity generation needed for each scenario. In each alternative, solar and wind are an important share of electricity generation.


