The Past Decade of Solar
Solar technology has come a long way since solar panels first hit the market in 1959 with Hoffman electric’s first 10% efficient panel. Now there are countless brands (here are the ones that we most often install) on the market that are double as efficient! Just in the past decade solar energy has seen some massive growth rates. In this post, we are going to take a look at just how much the solar energy market has grown over these past ten years. Graphs and data are supplied from the Solar Energy Industries Association.
Total Installed Capacity
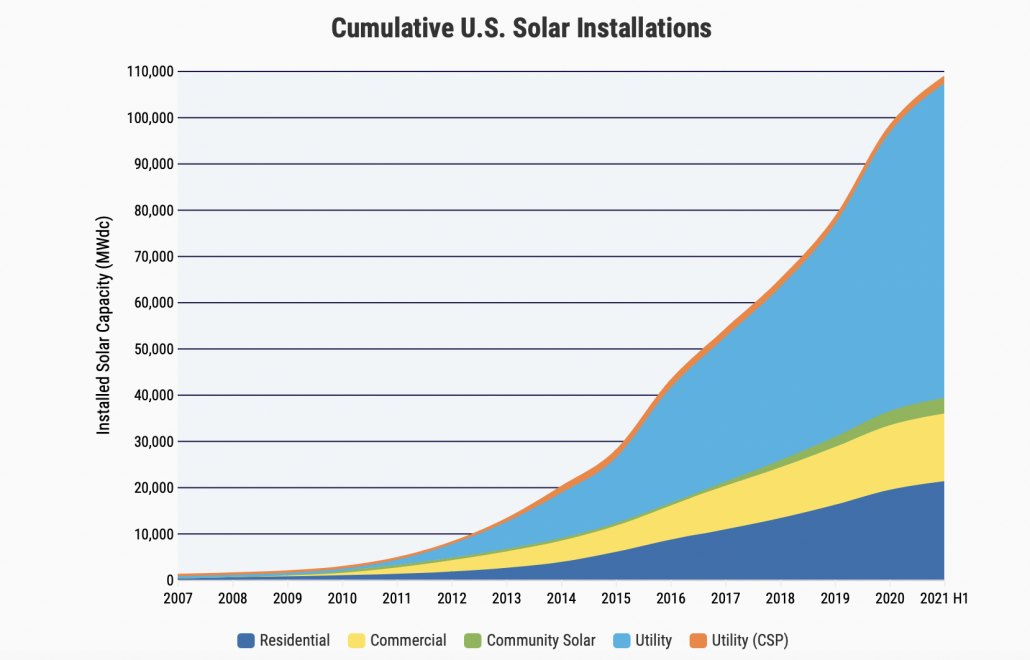
Solar has grown 43% in the last 10 years, the majority of this growth due to decreasing costs. To date, in the US there is a total of 108.7 GWdc of installed solar power. This has made up more than 3 million solar installations. In total, solar power produces enough energy for more than 18 million homes.
The graph on the right depicts total solar installations by category, measured in system size (kW). Currently, utility scale solar makes up the largest portion of total solar installations.
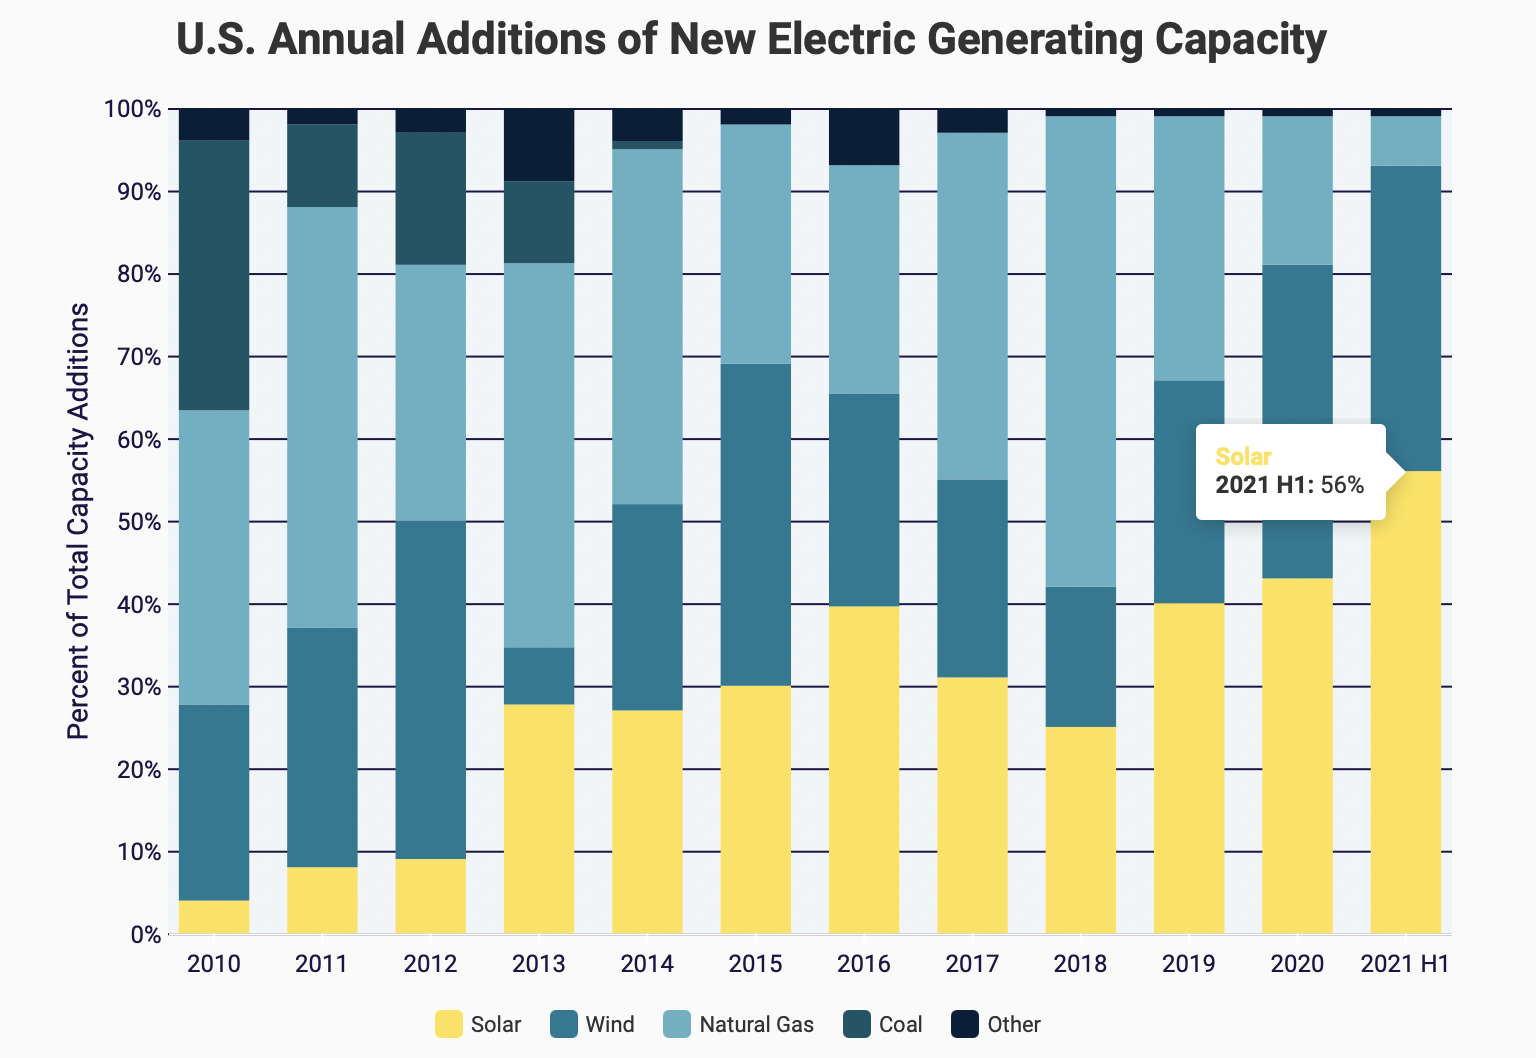
Thus far in 2021, solar power has made up more than half of new electricity installations. Also in 2021, residential solar has grown almost 40% since the second quarter of 2020. Additionally, community solar has grown 16% since this time in 2020. Overall, solar is growing this year and is still expected to grow until the federal solar tax credit runs out. Solar power currently makes up 4% of total electricity generation in the US. While this may seem like a small percentage, it only made up 0.1% in 2010. This means that solar now makes up 40x more of the total electricity generation than it did a decade ago!
The graph above shows all new types of installed electricity over the past decade, including solar, wind, natural gas, and other. Solar is represented in yellow. As shown, the proportion of new solar installations is rising relative to other types of electricity installations. The last bar on the graph illustrates that so far in 2021, 56% of new installed electricity has been solar energy!
Prices
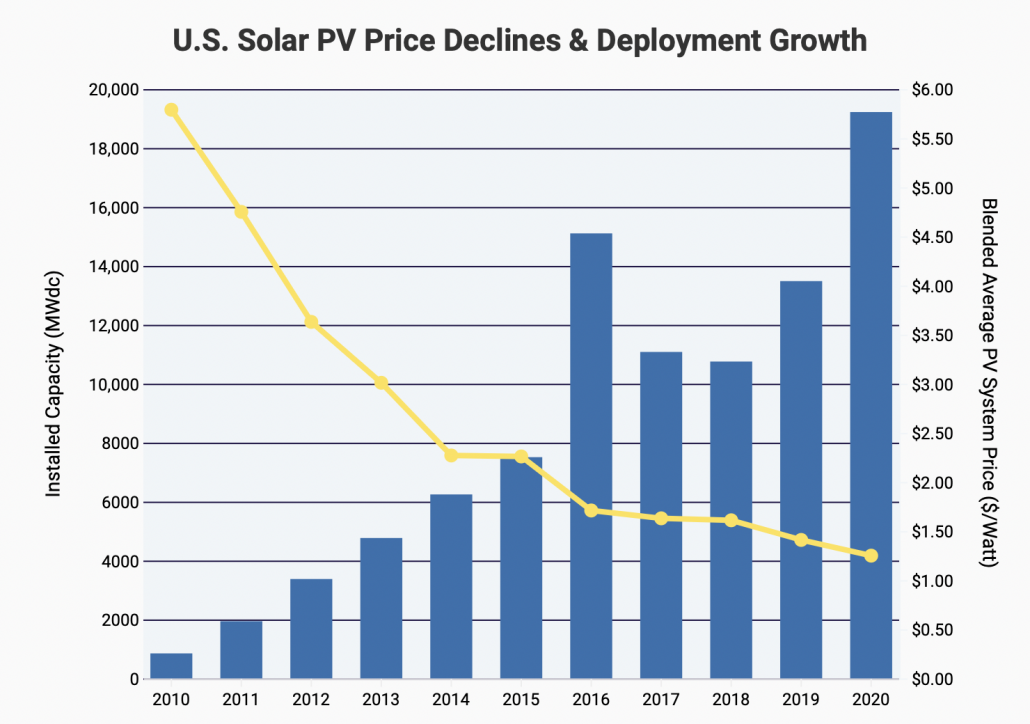
The price of solar power has decreased by almost 70% since 2014. The main reason for this is that technological improvements have decreased the cost of producing solar modules. According to the National Renewable Energy Laboratory, ten years ago a solar job would cost $2.50 per watt just for the solar panels themselves, not including any of the other costs of installation, permitting, etc. Now, the whole process costs around $1 per watt for utility-scale projects, including all of the other costs.
The graph on the right shows a line graph of declining solar prices on top of a bar graph of total installed solar capacity. It demonstrates that as solar prices have fallen, more solar panels systems are installed.


